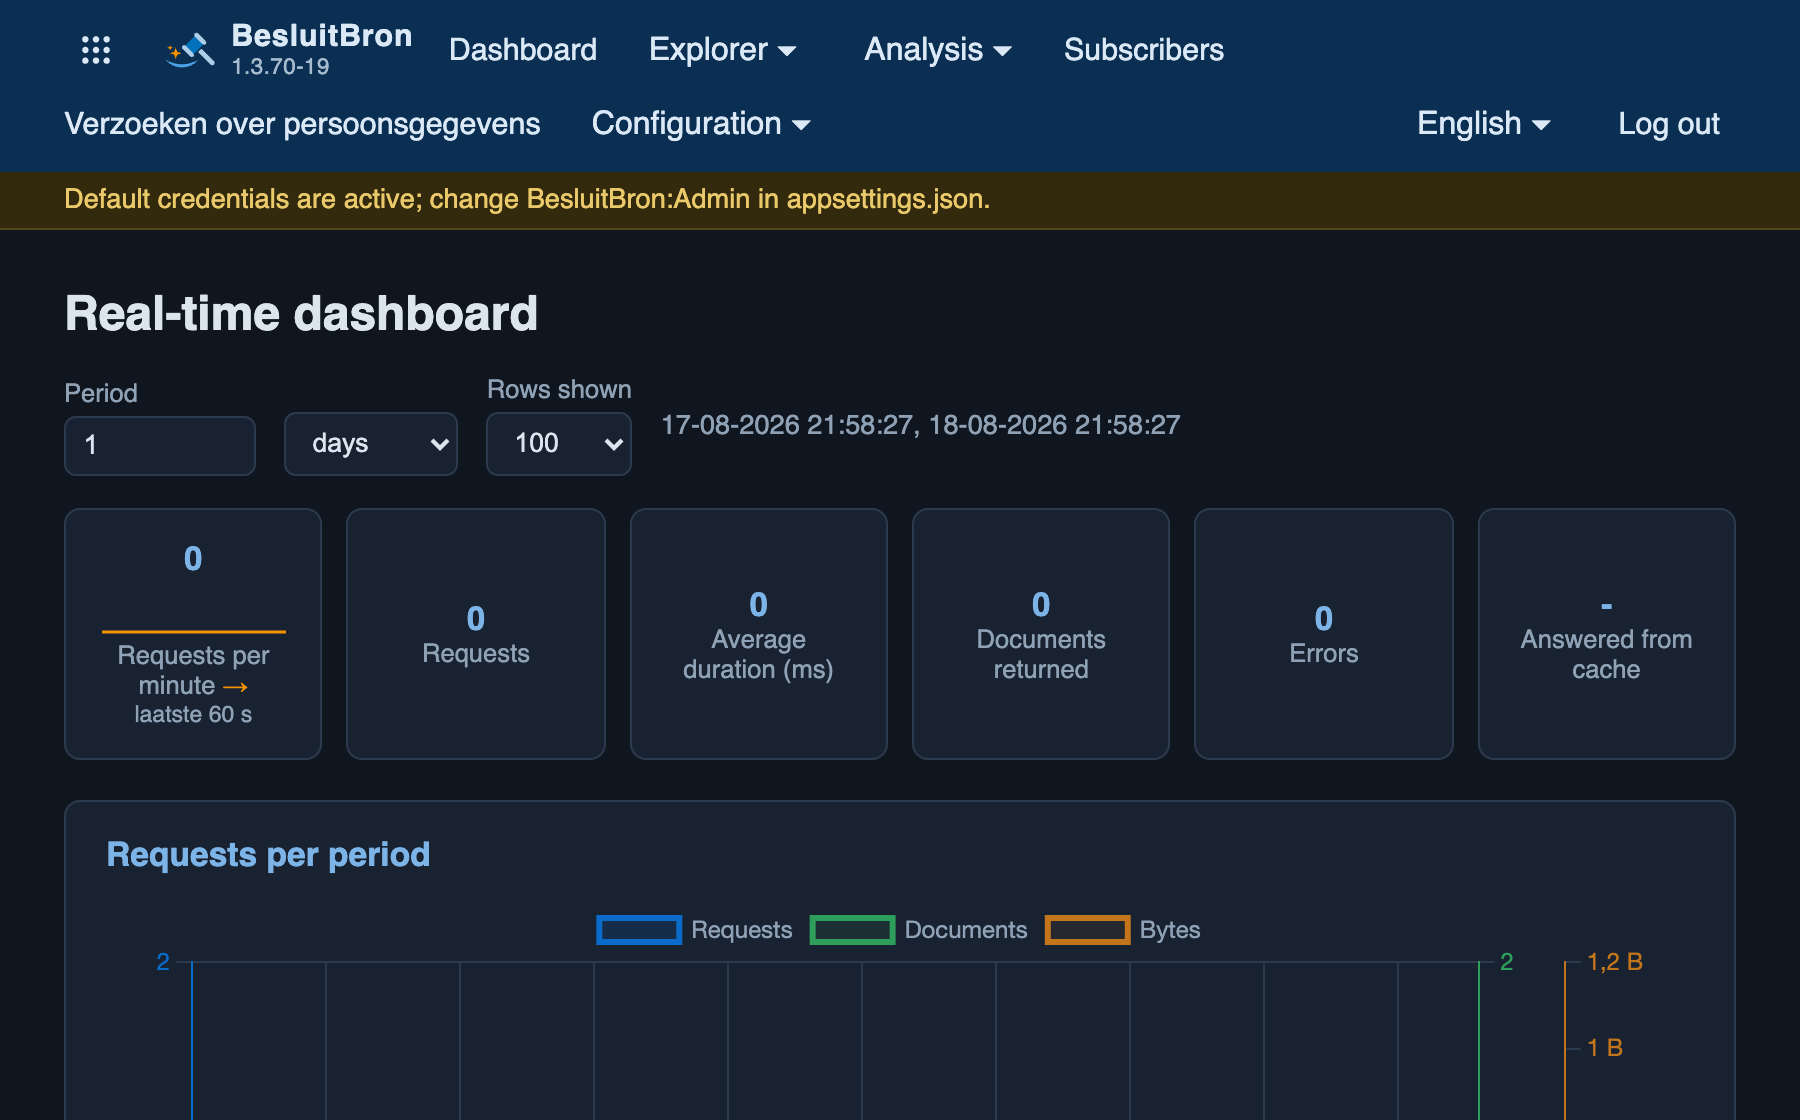
The console’s home screen. It displays, for the selected period, the number of requests, the average duration, the number of documents returned, the number of errors and the proportion of responses served from the cache. That last figure indicates whether the cache is working properly. If it is low, almost every query goes to the source platform and each query there counts towards the request budget. The tiles refresh automatically, without reloading the page.
From version 1.3.32 onwards, the number of requests per minute is displayed at the top. This is a running total for the last sixty seconds, with an arrow showing the difference compared to the previous minute and a small graph for the past hour. The figure updates every second and is independent of the selected time period, as it reflects the current moment rather than the time window. A high figure is not an error: it simply means the system is busy, and the tile does not turn red as a result.
From version 1.3.39 onwards, every tile is a link. The tile opens the screen showing the calls associated with that number, with the time period already filled in. ‘Requests’ and ‘Errors’ open the Calls screen, and ‘Errors’ applies a filter to show only the failed calls. ‘Average duration’ and ‘Documents returned’ open the Overview, next to the table for each tool. ‘Responded from cache’ opens the Response cache. The tile showing requests per minute opens today’s calls, as that number refers to the present and not to the selected period.
Filter calls and overviews by day. A one-hour period therefore covers the whole day, and thus includes more records than the tile can display. The line below the buttons continues to indicate which window the tiles themselves cover.
From version 1.3.54 onwards, the “Live activity” list includes an “Organisation” column. This displays the name that the client sent in the x-organisation header, even for a record that comes in live. A dash indicates that the client did not specify a name. See Logging en Verantwoording.
From 1 March 1976, the ‘Requests per period’ graph includes a fourth, dotted line: ‘Interactive search queries’. This line only counts the search queries that visitors type in themselves on the public search screen at /zoeken, one per request, regardless of how many sources that request retrieves a response from. This is because the “Requests” line counts each call to a source separately; therefore, a single search query there already counts as multiple requests. The new line shows what proportion of the total comes from that search screen rather than from an MCP client.