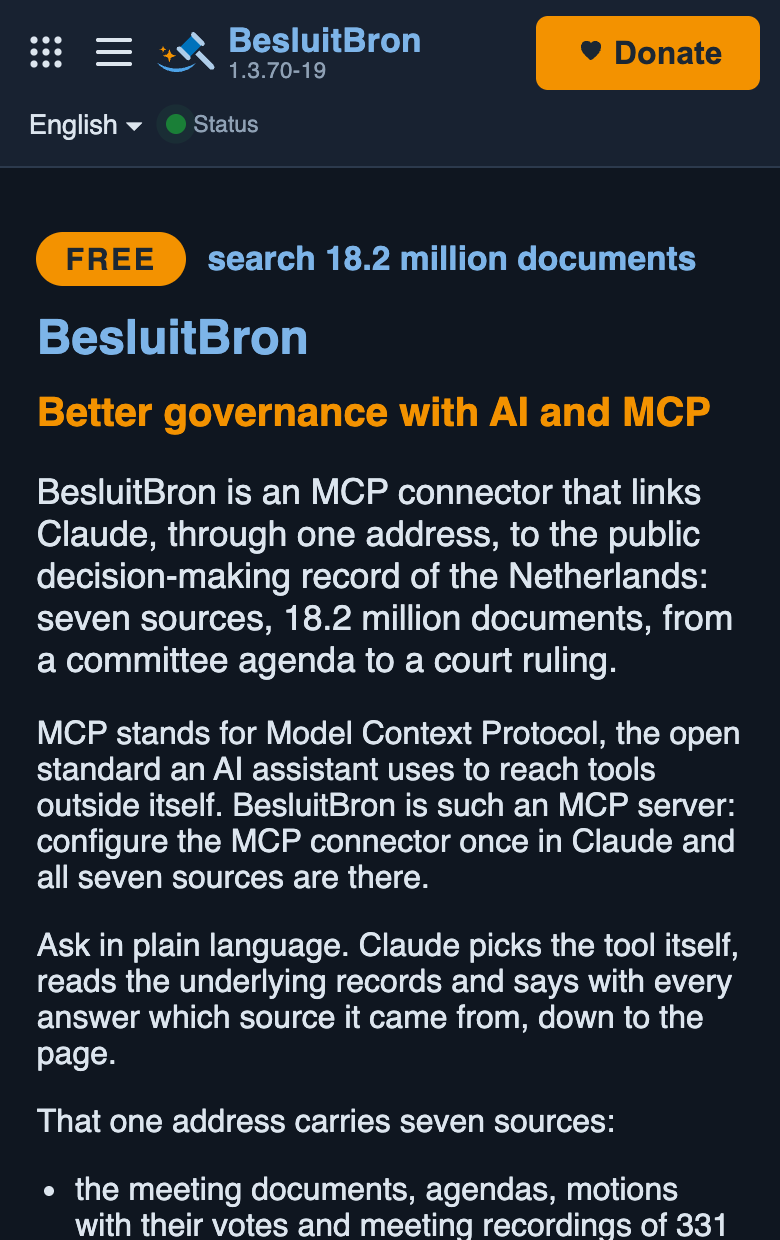
The first page displays, on a single screen, what is available under each address: the number of sources – ranging from the committee agenda to the court’s ruling – along with the number of documents per source. This number is calculated when the page is generated, so any sources that are currently unavailable are not included in the count. At the bottom is the MCP address for Alle Bronnen, with a button to copy it. Up to and including version 1.3.53, the address for each connector was listed separately there. The addresses for each source are listed at Connectoren and on each source’s page. The reason for this is explained at Connector. From version 1.3.54 onwards.
Since version 1.3.41, the label “FREE” has appeared at the top, alongside the number of documents that can be searched – shown in millions. This line is positioned high up on the page because, on a mobile phone, it is one of the few things that can be seen without scrolling. On a narrow screen, the number drops below the label. The number is based on the same data as the chart further down, so the two cannot differ from one another.
Since version 1.3.35, the first paragraph has defined what BesluitBron is in technical terms: an MCP connector. The second paragraph spells out that abbreviation once and states where the connector is configured. Up to and including version 1.3.34, the word ‘MCP’ appeared only in the technical section at the bottom, alongside the addresses. There are two reasons for this change: a reader who needs to assess whether this is the correct type of product can now see this in the first line, and a search engine will find the search term at the top of the page rather than at the bottom. See Model Context Protocol for details of what the protocol does and does not cover.
A graph showing the volume of the material
Since version 1.3.41, there has been a chart below the first few paragraphs. At the top is the total number of documents, shown in millions. Below that, there is a bar for each collection, arranged from largest to smallest, with the exact number shown next to each one.
The chart distinguishes between two things that are easily confused:
- a solid bar indicates material in which the text can be searched;
- The striped section contains information that can only be found in the attributes, such as title, date and organisation.
That distinction exists because the discrepancy is significant in the case of two sources. Around a quarter of the judge’s rulings have been published in full. Anyone who interprets ‘3.7 million’ as 3.7 million searchable texts will take a blank response as proof that no decision has been made. See Zoekprecisie.
Together, the sources provide five collections. Open Raadsinformatie and OpenBesluitvorming draw on the same local material, whilst the documents from the Tweede Kamer come from two sources. Sources that provide access to the same material are grouped together in a single bar, so each document is counted once.
Each figure has been measured directly on the source platform itself. The date of the oldest measurement is shown below the graph, as the total is no more up to date than the oldest measurement included in it. The measurements for each source can be found at Bronnen.
The figures are measured anew every day
Since version 1.3.41, the server has been measuring the size of each collection itself, by default once a day. Up to and including version 1.3.40, the figures were hard-coded into the software and only changed with a new version.
Once a day is a minimum requirement, not just a standard. Any lower setting is increased to 24 hours, and this is reported once in the trace. The server can therefore take measurements less frequently, but not more frequently.
This also applies after a restart. The server records in a file when it last took a measurement, and what it measured at that time. When it starts up, it reads that file. A container that is redeployed four times in the course of an afternoon will therefore take one measurement, not four. And after a restart, the page displays the most recent measurement, not the older figure from the software.
Each collection also includes a figure measured by hand, along with the date of that measurement. That figure is the ‘fallback’. As a result, there is always a figure with a date on the page:
- shortly after the server has started, if no measurements have yet been taken;
- if a source platform cannot be accessed;
- once the measurement has been plotted.
A measurement is not accepted blindly. The server rejects a result of zero, as well as any result that is more than one-fifth below the specified figure. Such a response can occur whilst the platform simply reports that everything is ‘fine’, for example when an index is being rebuilt. Without that limit, such a response would lower the figure at the top of the home page without anyone noticing. Growth is always recorded: these collections are growing.
A rejected measurement is recorded in the log, along with both figures. The page displays the recorded figure and states the date on which it was recorded.
See Installatie for the settings BesluitBron:Corpus.
Every figure relating to the dimensions on this page comes from that measurement: the line at the top, the graph caption, the line below it, and three of the five source lines. Up to and including version 1.3.40, those three source lines were hard-coded into the text, meaning the page mentioned the same measurement twice, a few centimetres apart: once as a measured value and once as a fixed value.
Two source lines do not specify a figure and are not given one. They list a number of bodies: 331 municipalities, provinces and water authorities, and 616 government bodies with Woo publications. None of the measurements count bodies, so those figures are listed in the source that mentions them.
If a source is switched off, the source line above it disappears and the total drops, just like the bar in the graph.
If a source is switched off, that bar disappears and the total figure goes down. See Connectorregister for more information on what switching sources on and off does.
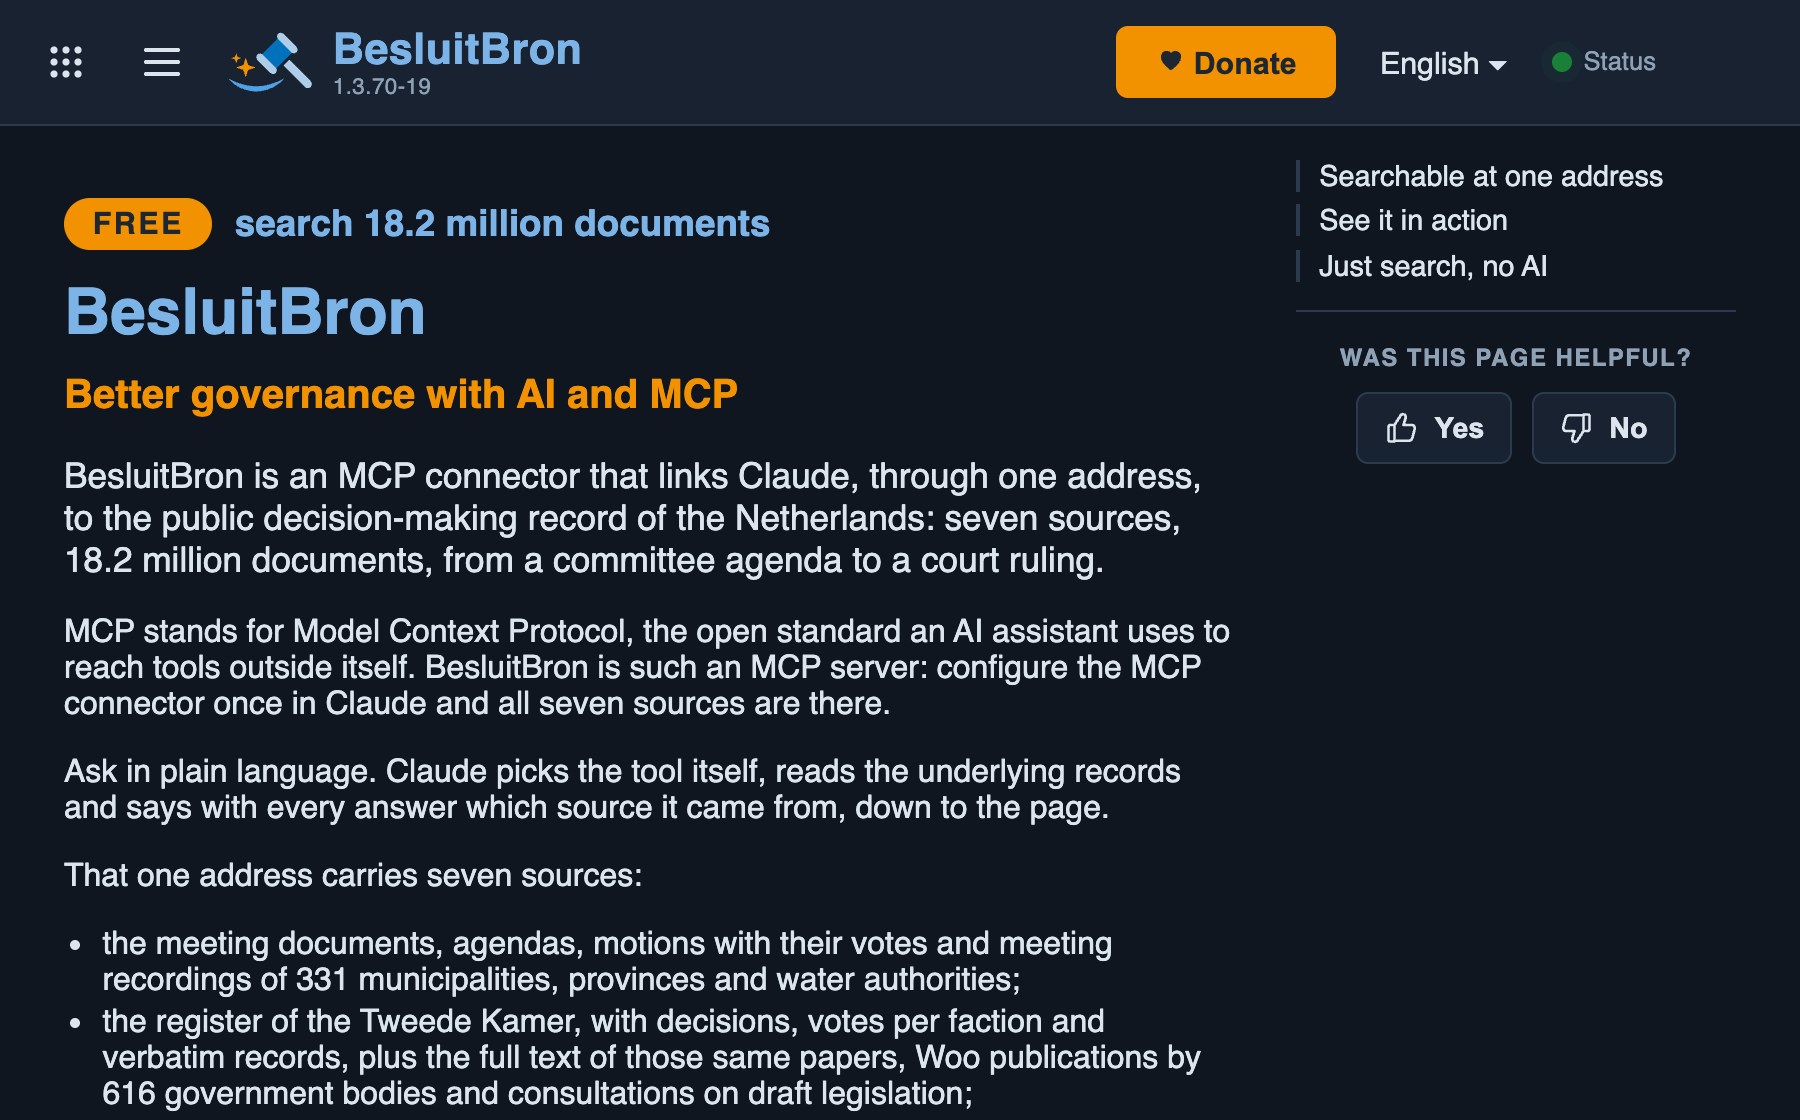
The same page on a mobile phone. All BesluitBron screens work from a width of 320 pixels, the narrowest mobile phone still in use: