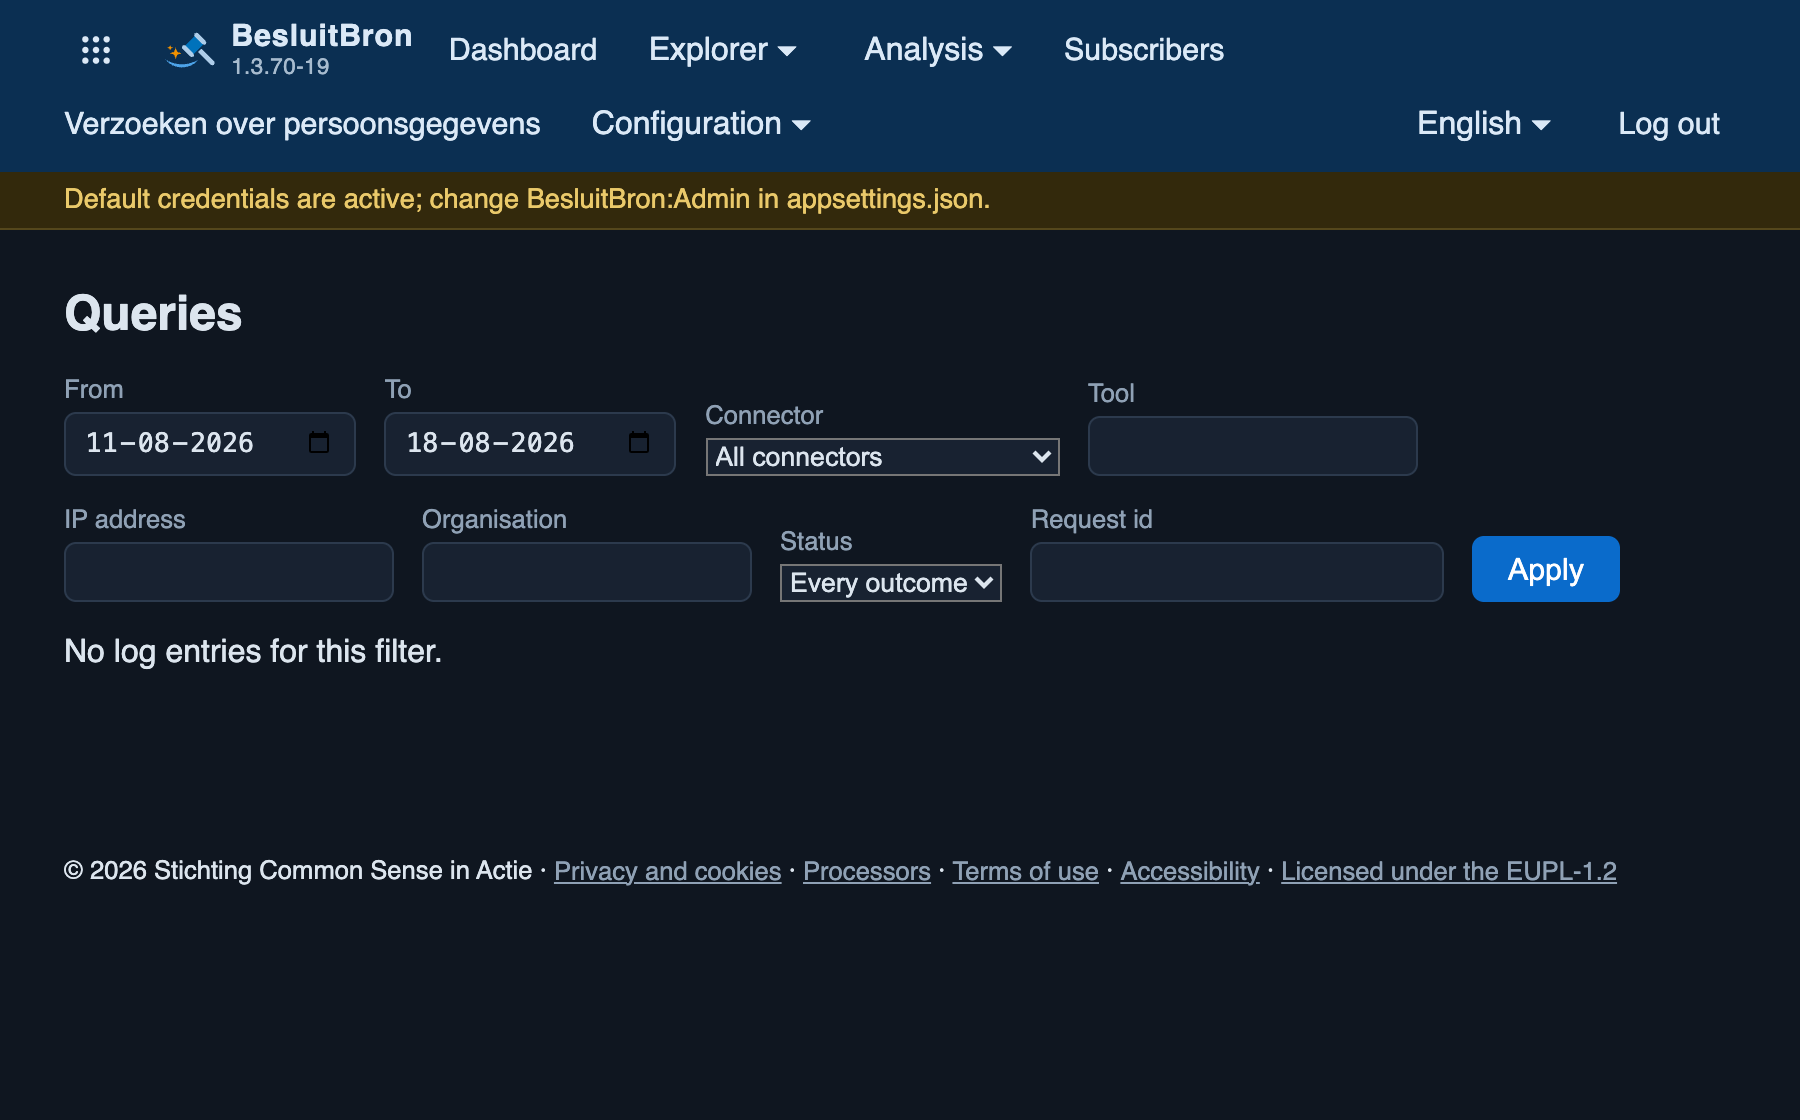
Each MCP request as a single line: time, connector, tool, duration, hits, documents, bytes, number of calls to the platform, IP address, organisation and whether it was successful. Expanding the row shows the arguments, the calls and an example of the response.
The ‘From memory’ column and the ‘Source’ column go together. The first indicates whether this request was fulfilled without any network traffic. The second indicates where the bytes ultimately came from: directly from the platform, or from the disk layer. A buffered line does not show a status, as nothing was called that could have returned a status; the cached status is shown in the tooltip. A failed call is shown in red.
From version 1.3.39 onwards, there is a ‘Status’ filter above the list. This allows the screen to display only the failed calls, only the successful ones, or all of them. The ‘Errors’ tile on the dashboard links to that filter, so that the number on that tile and the rows on this screen refer to the same calls.
From version 1.3.54 onwards, there is an ‘Organisation’ column next to the IP address, with a filter of the same name above the list. The column displays the name that the client sent in the ‘x-organisation’ header. A dash indicates that the client did not specify a name, which is the usual case. A long name is truncated; the full name appears in the tooltip and in the expandable section for that row. The filter searches for a part of the name, as the client chooses the spelling itself: ‘delft’ also finds ‘Municipality Delft, department of the council clerk’. What this header is and what it is not is explained at Logging en Verantwoording.